




Data Analytics & Business Intelligence
Evergreen Infotech transforms business data into actionable insights through interactive dashboards, automated reporting, data visualization, and predictive analytics to support smarter, data-driven decisions.


Data Analytics and Business Intelligence Services
Evergreen Infotech helps businesses understand their data and make informed decisions through data analytics and business intelligence solutions. We organize business information into meaningful reports, interactive dashboards, and visual insights aligned with operational and strategic goals.
Business Intelligence Dashboards
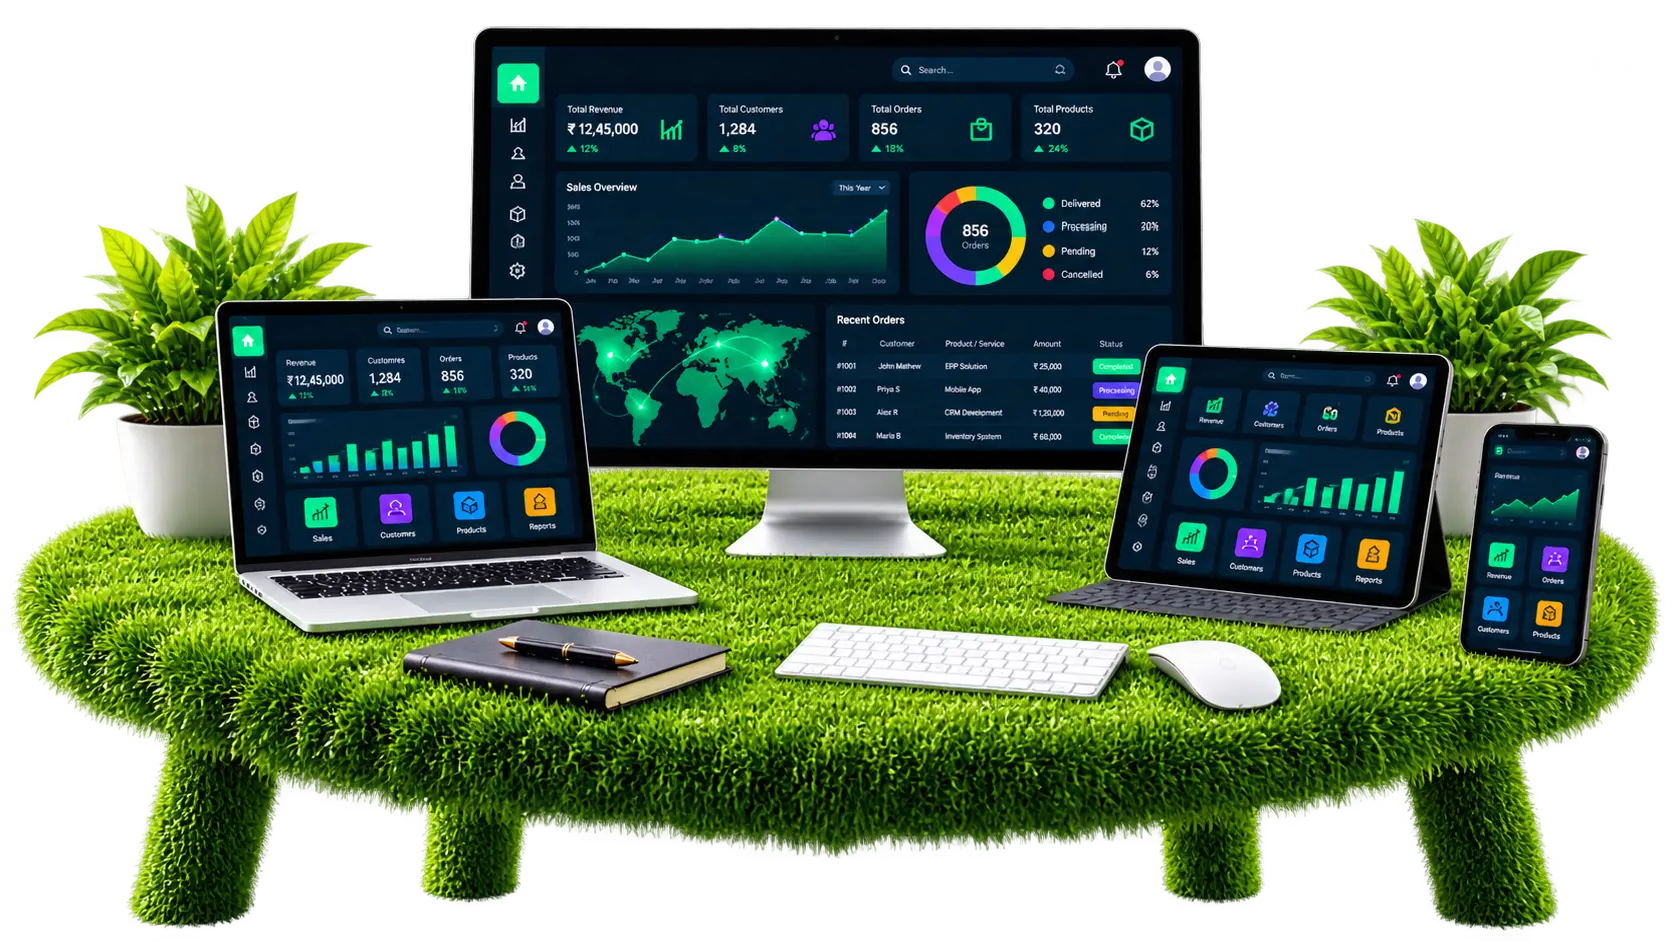
Build dashboards that present important business metrics, trends, and performance indicators in an accessible and organized format.
Data Visualization
Turn complex datasets into clear charts, graphs, and visual reports that make patterns and performance easier to understand.
Automated Reporting
Reduce repetitive reporting work by creating structured reports and suitable automated data workflows.
Sales and Marketing Analytics
Analyze available sales, marketing, and campaign data to understand performance, customer engagement, and opportunities for improvement.
Operational Analytics
Review suitable operational data to identify bottlenecks, monitor productivity, and improve business processes.
Data Integration and Preparation
Combine and organize data from compatible databases, spreadsheets, APIs, and business applications for more consistent reporting.
Predictive Analytics
Use suitable statistical methods and predictive models to explore potential trends and support planning, where sufficient quality data is available.
Custom Analytics Applications
Develop reporting modules and analytics features tailored to business software, SaaS platforms, and internal management systems.
Data Analytics for Businesses Worldwide
Based in Poovancode, Kanyakumari district, Tamil Nadu, India, Evergreen Infotech helps businesses locally and worldwide turn data into practical business insights.
Key Features
Business Intelligence Dashboards
View key business metrics and performance indicators in one place.
Interactive Data Visualization
Explore data through charts, graphs, and visual reports.
Automated Reporting
Streamline recurring reports and reduce manual reporting effort.
Sales Analytics
Review sales trends, product performance, and revenue metrics.
Marketing Analytics
Analyze campaign performance and available engagement data.
Operational Analytics
Identify process bottlenecks and monitor operational performance.
Data Integration
Combine data from compatible databases, APIs, and spreadsheets.
Data Cleaning & Preparation
Organize data for more consistent and reliable reporting.
Predictive Analytics
Explore potential trends using appropriate analytical methods.
Custom Analytics Modules
Integrate business reporting into existing software platforms.
Our Process
Business & Data Assessment
Understand your business goals, reporting needs, available data sources, and key performance indicators.
Data Collection & Preparation
Identify suitable data sources, review data quality, and organize information for analysis.
Analytics Planning
Define metrics, reporting requirements, dashboard layouts, and suitable analytical methods.
Dashboard & Report Development
Build visual dashboards, reports, and analytics features based on agreed requirements.
Validation & Review
Check calculations, data consistency, reporting accuracy, and dashboard usability.
Deployment & Improvement
Deploy the solution and refine reports, metrics, and analytics workflows as business needs evolve.
Frequently Asked Questions
Everything you need to know about our Data Analytics & Business Intelligence services, workflow, and ongoing support.
Get your project
done without headache